Discover tailored solutions for your business needs with our free quote service. Let our experts at HSR Hi-Tech Solutions guide you towards success. Request your complimentary quote today!
Thank you!
Your request has been submitted successfully.
Our team will reach out to you soon.
Business Intelligence Dashboard Development in Kolkata and Haldia: Turn Business Data into Better Decisions
Explore how custom BI dashboards help businesses in Kolkata and Haldia track KPIs, analyse data and make smarter decisions with HSR Hi-Tech Solutions.
S
System Admin
· 8 min read
In this article
Business Intelligence Dashboard Development in Kolkata and Haldia: Turn Business Data into Better Decisions
Businesses generate information every day through sales transactions, customer enquiries, marketing campaigns, inventory records, employee activities and financial operations. However, collecting data is only the first step. The real challenge is understanding what that information means and using it to make better business decisions.
Many businesses in Kolkata and Haldia still depend on spreadsheets, manually prepared reports and disconnected software systems to monitor their performance. As operations grow, these methods can make it difficult to identify trends, track important metrics and get a clear picture of business performance.
This is where Business Intelligence (BI) dashboards and data analytics solutions become valuable.
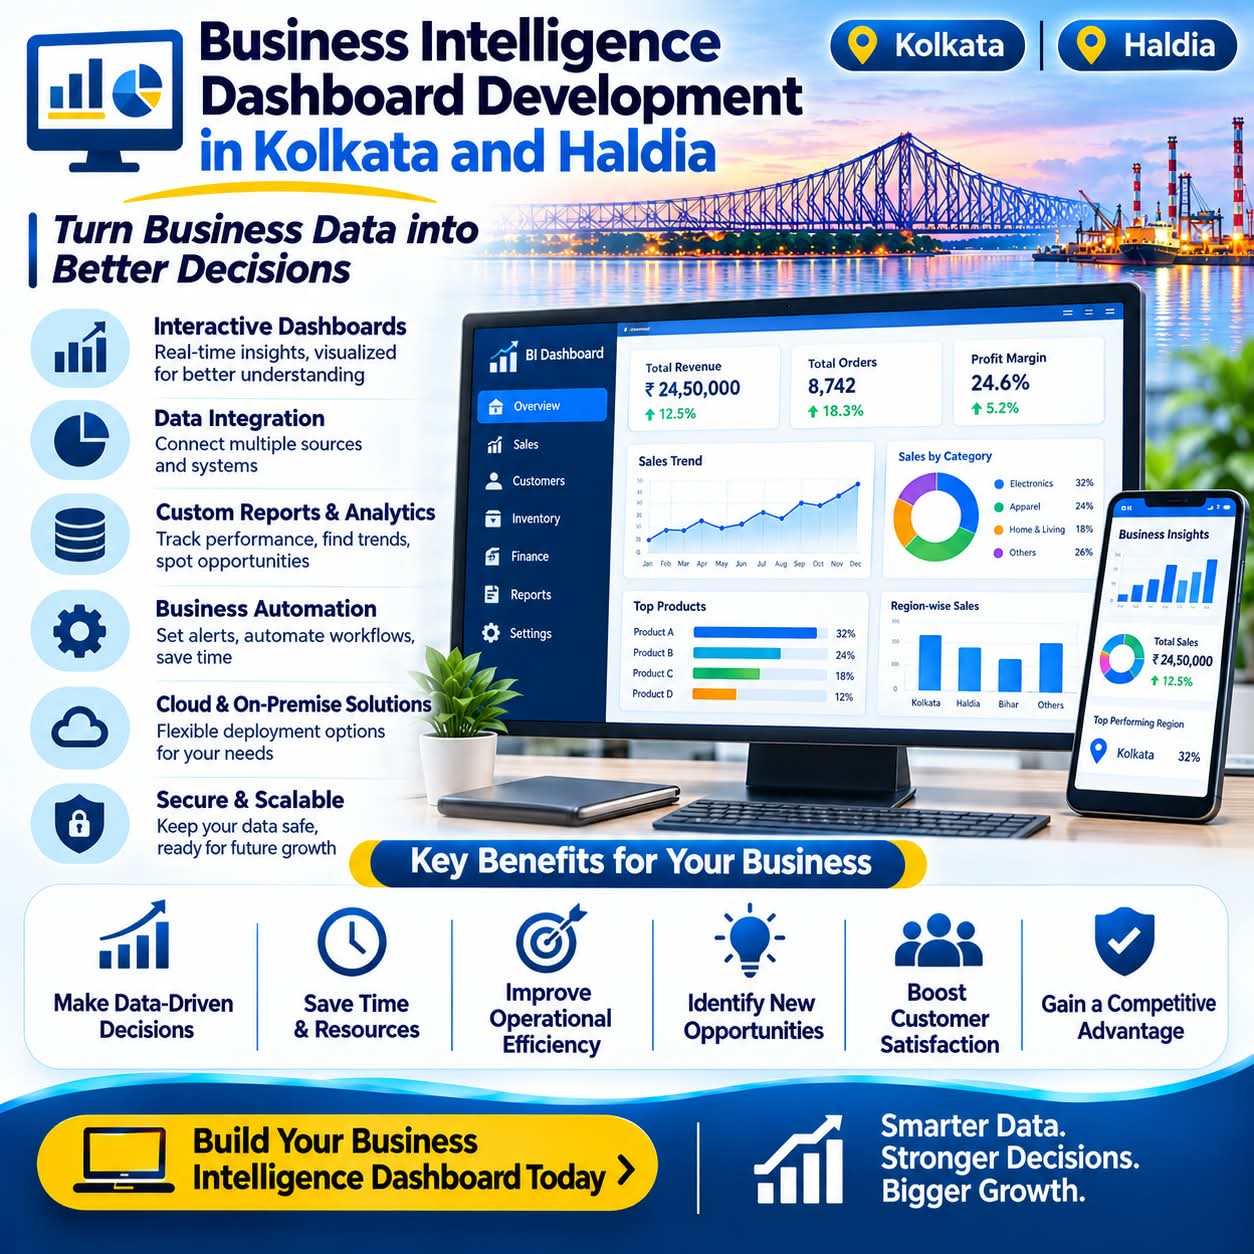
A custom business intelligence dashboard brings important business information together in a structured, visual format. It helps business owners, managers and decision-makers monitor key performance indicators (KPIs), compare results and identify areas that need attention.
HSR Hi-Tech Solutions helps businesses explore technology-driven solutions, including data science and custom software development, to support better business visibility and digital decision-making.
What Is a Business Intelligence Dashboard?
A Business Intelligence dashboard is a digital reporting interface that presents important business information through charts, graphs, tables, indicators and other visual elements.
Instead of reviewing multiple spreadsheets or manually combining reports, users can access relevant information from a centralised dashboard.
Depending on business requirements, a BI dashboard may display:
Sales performance and revenue trends
Monthly and yearly business growth
Customer acquisition and retention metrics
Marketing campaign performance
Inventory and stock movement
Employee and operational performance
Financial summaries and expense trends
Department-wise performance indicators
The dashboard can be designed around the organisation's reporting requirements, making it easier to understand information and monitor progress.
Why Businesses in Kolkata and Haldia Need Data Analytics
Kolkata has a diverse business ecosystem covering retail, manufacturing, education, healthcare, logistics, hospitality and professional services. Haldia also has significant industrial, trading, logistics and service-sector activity.
As these businesses expand, decision-makers need more than basic spreadsheets to understand their operations.
Here are some common challenges that business intelligence solutions can help address.
1. Business Information Is Spread Across Multiple Systems
A business may maintain sales information in one application, customer records in another and financial reports in spreadsheets.
When information is scattered, preparing a complete performance report can take considerable time.
A custom BI solution can bring information from supported data sources into a consolidated reporting interface.
2. Manual Reporting Takes Time
Many organisations prepare weekly or monthly reports manually. Employees may need to collect figures, check records, create charts and distribute reports to management.
Automated data processing and reporting can reduce repetitive work, depending on the available integrations and data quality.
3. Limited Visibility into Business Performance
Without clearly defined KPIs, management may struggle to understand which products are performing well, which departments need attention or where operational costs are increasing.
A dashboard makes important indicators easier to monitor.
4. Difficulties Identifying Business Trends
Historical data can reveal useful patterns in sales, customer behaviour, seasonal demand and operational performance.
Data analytics helps organisations examine these patterns rather than relying entirely on assumptions.
Important Features of a Custom BI Dashboard
A business intelligence dashboard should be designed around the organisation's actual goals. Not every business needs the same reports or visualisations.
Some useful features include:
1. Real-Time or Scheduled Data Updates
Depending on the source systems and integration capabilities, dashboards can display real-time, periodic or scheduled data updates.
For example, a retail business may require frequent sales updates, while a management report may only need daily or monthly refreshes.
2. KPI Monitoring
Key Performance Indicators help businesses measure progress against defined objectives.
Common KPI examples include:
Total revenue
Monthly sales growth
Number of new customers
Customer conversion rate
Average order value
Operating expenses
Inventory turnover
Employee productivity
Businesses can select KPIs based on their industry, size and management priorities.
3. Interactive Charts and Data Visualisation
Visual reports make complex information easier to understand.
A custom dashboard may include:
Bar charts for sales comparisons
Line charts for monthly trends
Pie charts for category-wise distribution
Tables for detailed records
Progress indicators for targets
Filters for date ranges and business units
4. Role-Based Dashboard Access
Different employees need different levels of information.
For example, a business owner may need an overall performance report, while a sales manager may only require sales-related information.
Role-based access can help ensure that users see the information relevant to their responsibilities.
5. Exportable Reports
Businesses may need to share reports with management, accountants or department heads.
Depending on the solution, dashboards can support report exports in formats such as PDF, Excel or CSV.
Business Intelligence Dashboard Use Cases Across Different Industries
BI dashboards are not limited to large corporations. Small and medium-sized businesses can also benefit from structured reporting.
Manufacturing and Industrial Businesses
Manufacturing organisations can use dashboards to monitor production output, operational downtime, inventory movement, order status and quality-related indicators.
For businesses operating in and around Haldia, these reports can support better operational visibility.
Retail and E-commerce Businesses
Retailers can analyse sales trends, product performance, customer purchases and stock movement.
A dashboard can help identify popular products, slow-moving inventory and changes in demand.
Educational Institutions
Schools, colleges and training organisations can monitor admissions, fee collections, student attendance, course enrolments and academic reporting through customised dashboards.
Hospitals and Healthcare Organisations
Healthcare management dashboards can present operational information such as appointment volumes, department activity, resource utilisation and administrative reports.
Any patient-related data must be handled with appropriate privacy, security and access controls.
Logistics and Transportation Companies
Logistics businesses can analyse delivery performance, shipment volumes, vehicle utilisation, operating expenses and service-level indicators.
Custom BI Dashboard vs Traditional Spreadsheet Reporting
Spreadsheets remain useful for calculations and smaller reporting tasks. However, as business operations become more complex, a dedicated dashboard may provide a more convenient way to monitor information.
Comparison
Spreadsheet Reporting
Custom BI Dashboard
Data presentation
Rows, columns and charts
Visual reports and interactive charts
Updates
Often manual
Can be automated where supported
Data consolidation
Manual or formula-based
Can integrate supported data sources
KPI monitoring
Requires manual setup
Centralised KPI view
User access
File-based sharing
Can support role-based access
Business insights
Depends on manual analysis
Supports structured visual analysis
The right choice depends on business size, reporting frequency, data complexity and budget. A small business may be perfectly comfortable with spreadsheets, while a growing organisation may benefit from a dedicated dashboard.
How to Choose the Right BI Dashboard Development Company in Kolkata or Haldia
Selecting a technology partner is an important decision because a dashboard is only useful when it presents accurate and relevant information.
Before choosing a development company, consider the following factors.
Understand Your Reporting Requirements
Identify the business questions you want the dashboard to answer. Define the KPIs, departments, reporting frequency and intended users before development begins.
Evaluate Data Integration Capabilities
Check whether the development team can work with your existing databases, spreadsheets, business applications and APIs.
Not every system supports direct integration, so technical feasibility should be assessed before finalising the project scope.
Prioritise Data Accuracy and Security
Incorrect or outdated information can lead to poor decisions. Ask how the solution will handle data validation, access permissions, backups and secure data transfer.
Look for Customisation and Scalability
Choose an approach that can accommodate additional reports, users and data sources as your business grows.
Evaluate Support and Maintenance
Dashboards may need updates when business requirements or source systems change. Discuss documentation, maintenance and future enhancement arrangements.
How HSR Hi-Tech Solutions Can Help
HSR Hi-Tech Solutions is an MSME-registered and ISO-certified IT company serving businesses in Kolkata, Haldia and other parts of India.
Our technology services include data science, custom software development, cloud computing, AI and machine learning, and business-focused digital solutions.
For organisations exploring business intelligence and analytics, the development approach can be planned around their reporting objectives and existing technology environment.
Depending on project requirements, a custom solution may include:
Business-specific KPI dashboards
Interactive charts and data visualisation
Data consolidation from supported sources
Automated reporting workflows
Custom analytics interfaces
Role-based access management
Scalable web-based reporting applications
The exact features, integrations, technology choices and implementation timeline are determined after understanding the project's requirements.
Whether your organisation operates in manufacturing, retail, education, healthcare, hospitality or logistics, a well-planned analytics solution can help make business information more accessible and useful.
Frequently Asked Questions (FAQs)
1. What is the cost of BI dashboard development in Kolkata?
The cost depends on dashboard complexity, number of users, data sources, integrations, reporting requirements and security needs. A basic reporting dashboard generally requires less development effort than a multi-department analytics platform. A project estimate should be prepared after reviewing the requirements.
2. Can a BI dashboard integrate with existing business software?
Yes, integration may be possible through APIs, database connections, supported connectors or structured file imports. Feasibility depends on the existing software and the access it provides.
3. Are BI dashboards suitable for small businesses?
Yes. Small businesses can start with a focused dashboard covering essential metrics such as sales, expenses, customer enquiries and inventory. The solution can be expanded as reporting needs grow.
4. Can dashboards display real-time business information?
Real-time reporting may be possible when the underlying data source, integration method and infrastructure support frequent updates. Some projects may use scheduled updates instead.
5. What is the difference between Business Intelligence and Data Analytics?
Business Intelligence generally focuses on organising and presenting business information through reports, dashboards and performance indicators. Data analytics involves examining data to identify patterns, relationships, trends and insights. Both can work together to support business decisions.
6. Does HSR Hi-Tech Solutions provide custom dashboard development?
HSR Hi-Tech Solutions offers data science and custom software-related technology services. Businesses can discuss their dashboard and analytics requirements with the team to determine the appropriate project scope and implementation approach.
Conclusion: Make Business Data More Useful with the Right Technology
As businesses in Kolkata and Haldia continue to adopt digital tools, the ability to understand business information is becoming increasingly important.
A well-designed Business Intelligence dashboard can simplify reporting, improve performance visibility and help management make informed decisions. The key is to build a solution around meaningful KPIs, reliable data sources and the actual needs of the organisation.
If your business is spending too much time preparing reports or struggling to understand its performance data, it may be time to explore a customised analytics solution.
Looking for Business Intelligence or Data Analytics Solutions in Kolkata or Haldia?
Connect with HSR Hi-Tech Solutions to discuss your business requirements and explore suitable technology solutions.
Part of the team at HSR Hi-Tech Solutions, an MSME-registered IT company in Kolkata and Haldia building websites, apps, ERP and AI solutions, and running the marketing campaigns we write about.
Discover how to kickstart your SEO journey with our comprehensive guide for beginners. Learn the essential steps to optimize your online presence and boost visibility. Get started with HSR Hi-Tech Solutions today.
Unlock the power of image optimization to boost your website's SEO performance. Learn effective image SEO techniques with insights from HSR Hi-Tech Solutions and elevate your online presence.
Elevate your video content with expert Video SEO strategies from HSR Hi-Tech Solutions. Learn how to optimize your videos for search engines, drive more traffic, and boost engagement.